KNOW THE STEPS OF THE MAPBIOMAS PERÚ METHODOLOGY
Here you will find the main features, how we organize our work and an overview of the methodology MapBiomas Perú uses to generate the land cover/use maps and transition / land use change maps.
You can access the ATBD (Algorithm Theoretical Basis Document) that describes in detail the methodology and algorithms used.
DOWNLOAD THE COMPLETE METHODOLOGY - ATBD
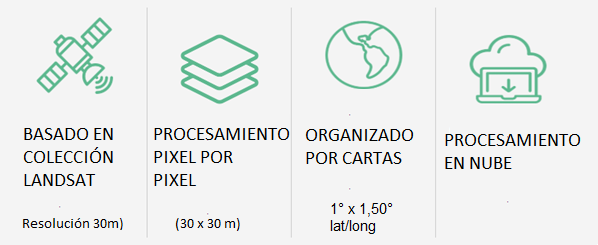
GENERAL CHARACTERISTICS
All MapBiomas Perú annual land cover/use maps were produced from a pixel by pixel classification of the Landsat satellite images. The whole process is carried out using machine learning algorithms at the Google Earth Engine platform, which offers immense cloud processing capabilities. In order to facilitate the parameterization of the algorithms and the organization of all the processing stages, a total of 107 charts are used. Each chart has a 1 x 1.5 degree (lat / long) dimension.
HOW WE GET ORGANIZED
Teams of programmers, specialists in remote sensors, conservation and land use are organized by biome and cross-cutting themes. More details can be found in the "About Us" section.
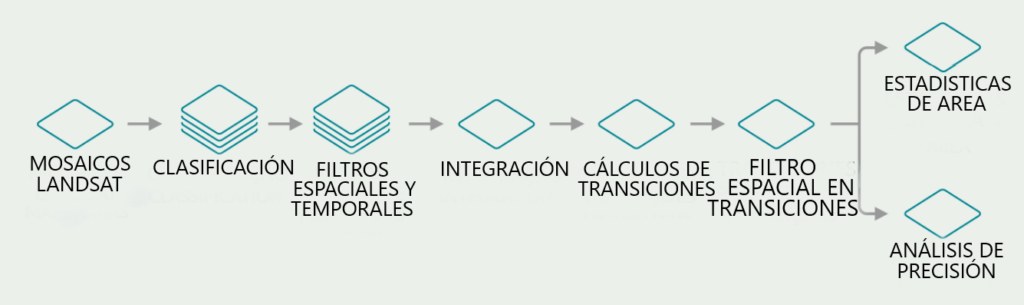
OVERVIEW OF THE METHODOLOGY
The following diagram illustrates the key steps in the process of generating the annual land cover/use maps of MapBiomas Peru as well as the transition and land use change maps.